ALM recently released its “2021 Global 200” law firms. (The “2021” rankings reflect FY 2020 results, as is ALM’s somewhat perverse custom.) These are, by their count, the largest 200 firms in the world by revenue. They also released the “2021 Global” firms ranked by PPP, but truncated the list at the top 100, for reasons best known to ALM. Data hygiene, perhaps? But we digress….
A few highlights before we begin the fun.
- Total gross revenue for the Global 200 was $161.8 billion.
- (Currency conversions to US$ done at the “annual averages for 2020;” lawyer numbers are average FTE’s; most figures taken from the AmLaw 200, “other firms” were “surveyed directly.”)
- Gross revenue was up 5.9% vs. FY 2019
- Firms’ “nationalities” were determined by the country in which they have the most lawyers, not, somewhat interestingly, by the location of their HQ or historic city of origin.
- 51 firms counted more than $1.0 billion in revenue, up 1 (2%, if you’re counting) from 2019.
- Speaking of nationalities, the headline breakdown was like this:
- 37 in the US
- 26 in the UK
- 37 everywhere else.
Now, shall we see what else their data shows?
I thought the following “divisors” would be of interest, in comparing the different countries represented by the Global 200:
- Firm count by country
- Total revenue by country
- Lawyers by country
- “Average” RPL by country[1]
Aside from the pie charts that follow, a few observations that lend themselves more readily to narrative than to numeric displays:
- In terms of PPP, the top 20 firms are all US-centric
- 9 of the next 10 are US
- The exception is Slaughter & May @ #27
- Of the “middle 40” firms (#30–#69):
- 33 are US
- 6 of the remaining 7 are UK (the Magic Circle quartet plus Ashurst and HSF)
- the remaining 1 is Canadian: Osler
- Not until the bottom-most decile do Chinese firms appear: Of the final 10 firms (#91–100)
- 2 are US
- 2 are UK
- And 6 are Chinese.
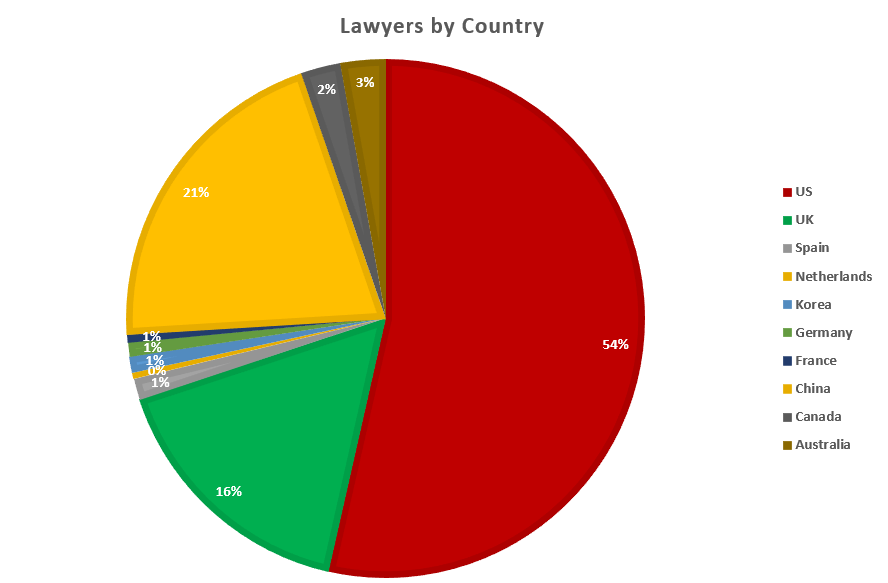
Let’s start with the most obvious metric, headcount/population, or lawyers by country:
It’s no surprise that the US is #1, but it accounts for barely more than half the lawyers in this dataset, and China is a strong second, one-third larger than the UK on this metric.
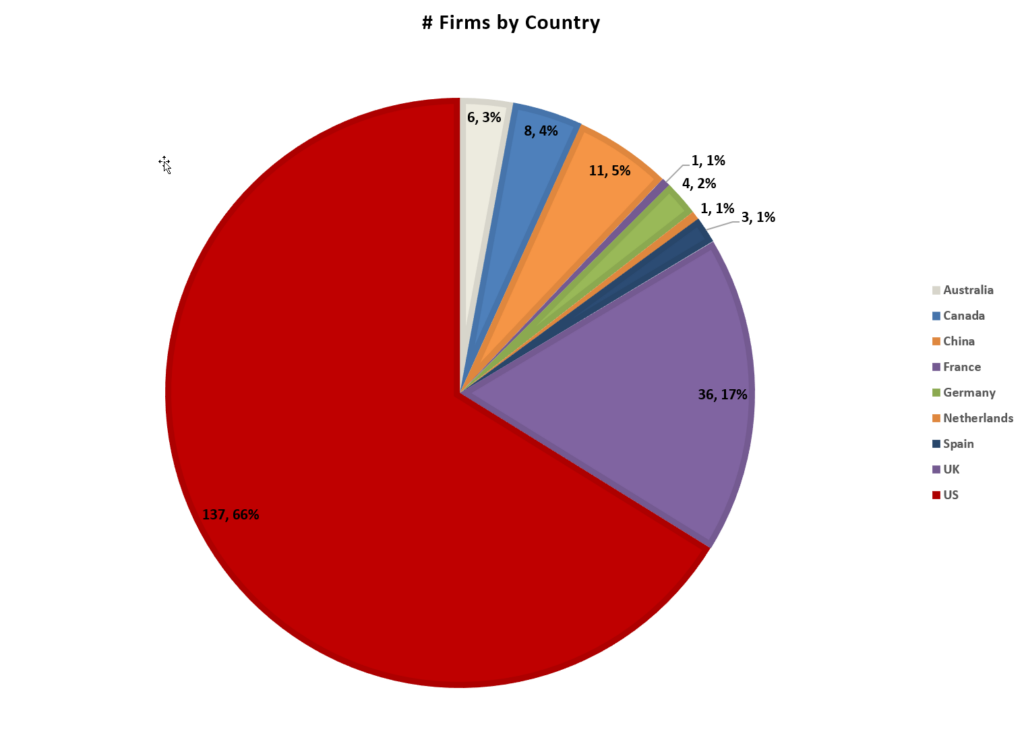
Now let’s go to perhaps the next most obvious comparo metric, the number of law firms that made the Global 200 cut, by country. The detailed data labels show # first, [comma], % of total 200.
The picture begins to change, with the US and the UK strongly leading the pack, but China in a solid third, and its 5% today would have been much less as recently as 2015.
Time to get into the financials (you are reading Adam Smith, Esq., after all).
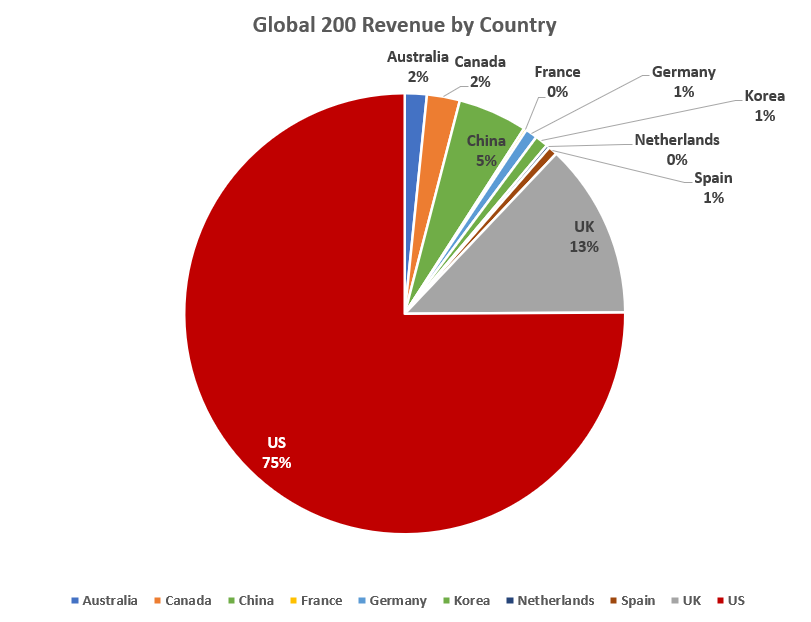
Let’s go for revenue by country:
The story is beginning to build, but as always hereabouts you can draw your own conclusions.
Sharpen the knife, shall we?
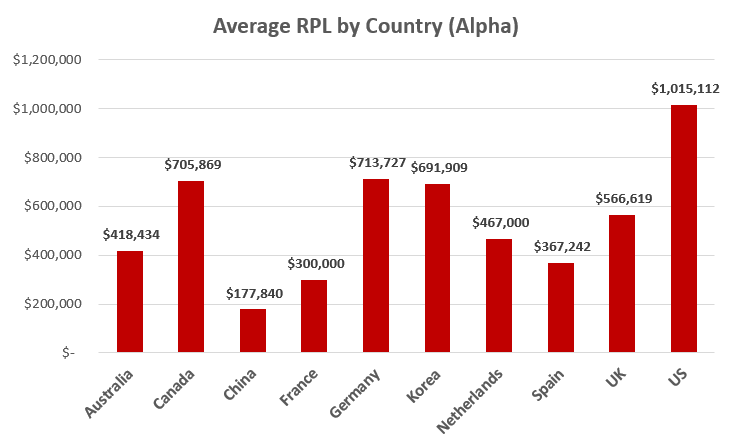
As regular readers know, RPL is our favorite “desert island” (if you could only have one…) law firm performance metric, since it’s
- hard to game,
- measures the value of a firm’s lawyers in the eyes of its clients (what it would cost to rent one lawyer from that firm for one year);
- and is in the long run reflective of a firm’s strategy; wherever you want to be on the mind-map positioning landscape of BigLaw, your RPL will tell you without pity whether you’re there.
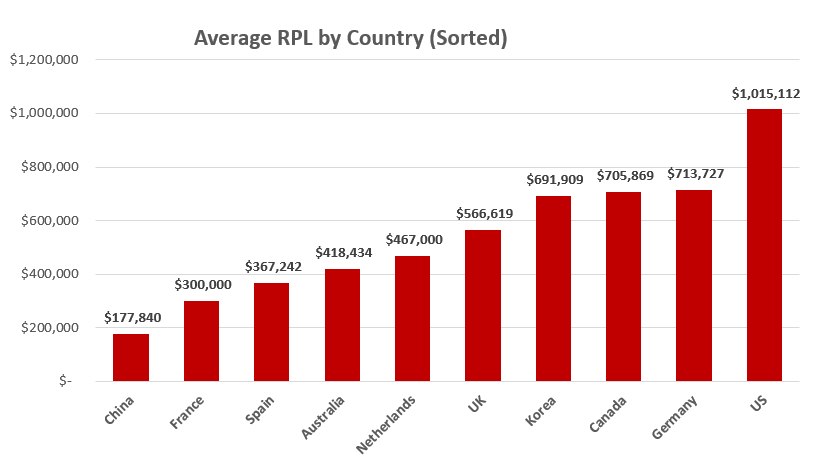
Now let’s sort these same figures in rank, not alpha, order:
Here the US/UK/China “rivalry” that we’ve toyed with earlier in this column begins to take real form. China is 10th of the 10 countries represented here and the US 1st: Perhaps nothing amazing or astonishing to our readers, but the nuances that come out in this chart are to my mind intriguing and worthy of further analysis. Note the three countries (in order) between the US and the UK: Germany, Canada, and Korea: and all within a mere span of 3% of each other. For all practical purposes, these three countries are indistinguishable.
Then, the gap from the UK and China: The Netherlands, Australia, Span, and France: But here the gap spans 89%, or a difference so great as to constitute a gulf. These are firms experiencing different economic realities.
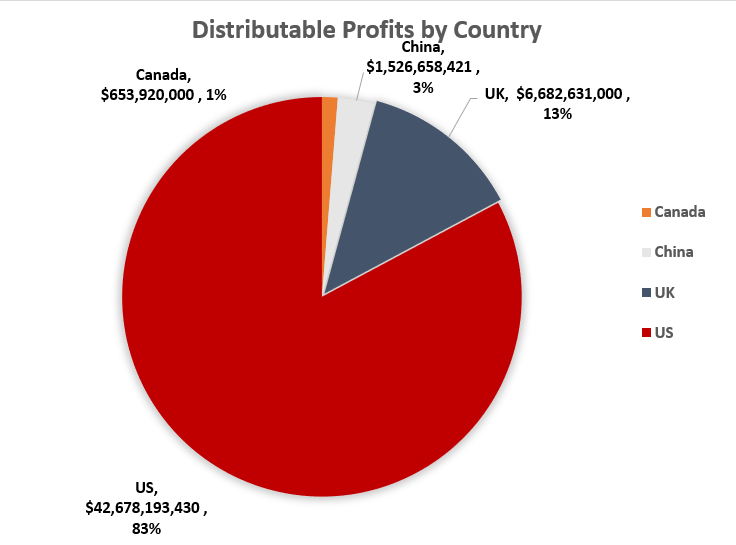
Finally, reflect on this: “Distributable” profits by country
To produce these figures, I multiplied the profits per partner (PPP) figures for each firm in each country by the number of equity partners at each firm and summed the totals by country.
If this isn’t eye-popping to you, it was to me.
[Methodological notes: The AmLaw Global “200” does not include PPP data; as mentioned at the top of this column, only the Global “100” does (ask AmLaw…), so by this metric six of our ten countries drop out.]So we’ve gone from the US share of market gong from 54% of lawyers to 66% of firms to 75% of revenue to 83% of distributable profits.
We will have future thoughts about why this might be so–and warmly welcome any readers’ thoughts on this–but our parting observation for today is that for reasons yet to be further elaborated, the US legal/economic/business/regulatory ecosystem seems remarkably efficient at converting lawyer labor to profits.
[1] Note to the fastidious numerati: I calculate this by multiplying the number of lawyers in each firm by the RPL for that firm, and then taking the sum of those results for all firms in country X and dividing it by the total number of lawyers at firms in country X. The goal is to generate as accurate as possible a calculation of (total revenue generated by firms in that country) ÷ (total number of lawyers in that country), rather than the average of RPL across firms.

