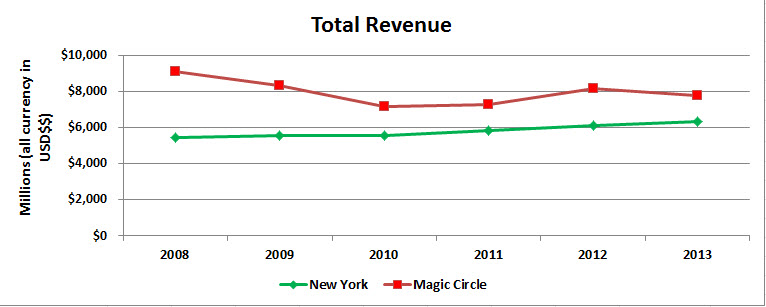
This chart tells two stories:
- The Magic Circle’s revenue has not again been as high as it was in 2008, and the New York firms’ revenue has not again been as low as it was in that year.
- The London/NY ratio in 2008 was about 1.67:1 and by 2013 was 1.26:1
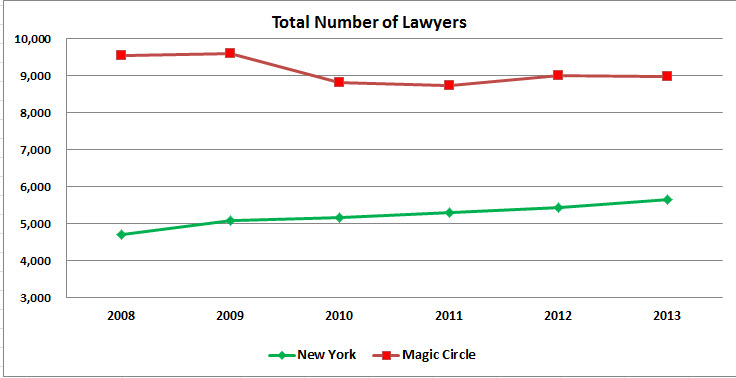
Here’s a very similar story:
- The Magic Circle’s all-time high headcount was 2008/2009 at around 9,600 lawyers and New York’s all-time low headcount was 2008.
- London went from about twice the size of New York to about 1-1/2 times as large.
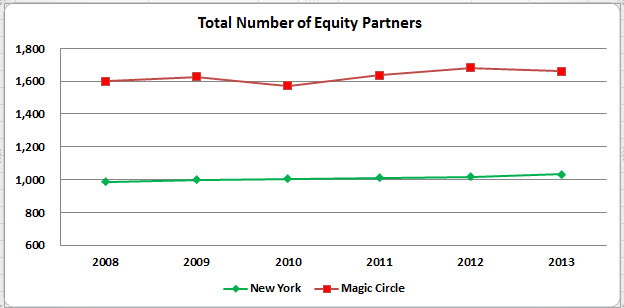
Great discipline exerted all around. Both these lines are almost horizontal, with strongly constrained growth on the entire half decade. However else they may differ, these firms have tightened the screws at the top.
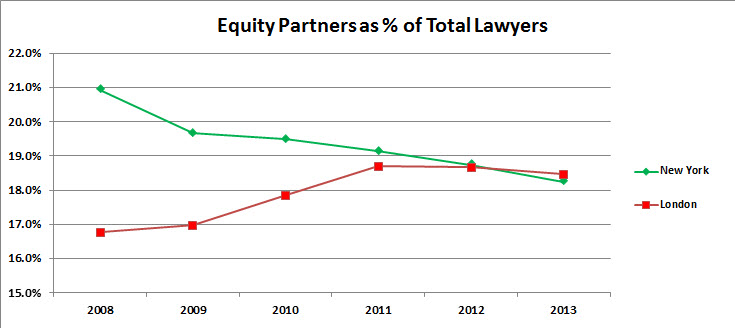
The inevitable sequel to the previous chart, answering the question, “How does total lawyer headcount compare to equity partner headcount?” Not to be Euclidean about it, but just under 20% appears to be the Golden Mean upon which the transatlatnic elite are converging.
Should other firms take heed? Well, at least they should take note.
Now we cross over from the land of tonnage and throw-weight into the realm of judgment and implications.


Very interesting – thank you!
Do you think that the figures are (heavily) impacted by currency fluctuations between 2008 and 2013?
You’re welcome!
The short answer, to my mind, about currency fluctuations is:
My bottom line is: Can’t do anything about them, so let’s ignore them.
How do the numbers differentiate (or do they) between compensation paid to equity partners as profit v. salary treated as an expense? Is everything paid to an equity partner treated as profit?
On a less serious note, any post that references Warner Wolf is ++ in my book. Now if you can somehow work in a reference to Jerry Girard we’d really be talking.
Unfortunately you’ve completely ignored the fact that the pound –the billing currency of the lion’s share of magic circle ops — was at multidecade highs of over $2:£1 in 2008, then fell back by about 25%, with high volatility (like all financial markets!). This by itself accounts for most of the trend in several of the charts you put forth which measure performance in dollars. Of course New York looks less volatile when you measure things in US currency! Of course the Magic Circle declines during years when GBP declines! It’s a shame you didn’t think to address this variable since it is a far more significant determinant than any of the theories you put forth in your article.
I actually used each year’s average GBP/USD exchange rate for that year, as opposed to one average over the entire period. That’s the methodology.
As for the substance of your observations, let us stipulate that the currency movements you posit are correct. What, then, is one to do in terms of analysis? I don’t think the managing partners of any of the firms identified in the piece would suggest they be ignored, or can be ignored in real life when it comes to partner compensation time. At the risk of being simplistic, yes indeed currencies fluctuate. It strikes me as a hard fact on the ground that one simply has to build into any crossborder analysis of this sort. I don’t see any alternative route.
You finish this with the question “What do you think this lineup will look like in 2020?” Might now be a suitable time to revisit?
In ordinary days, you would not be wrong, but given what’s going on in the world this year I think it only prudent to table this until we emerge on the other side, either via universal vaccine or brute-force herd immunity, which some elected leaders seem to be pursuing in deed if not in word.