A famous former (and now late) leader of the US House of Representatives, the classic Boston pol Tip O’Neill, supposedly remarked that “all politics is local.” To that I would add MacEwen’s corollary, that “all rivalries are local.”
In many ways, the leading candidate for most intense local rivalry in BigLaw is between London’s four Magic Circle firms and New York’s white shoe elite. Both groups of firms operate at the top of the food chain, attracting the top talent, working for the most sophisticated and demanding global clients, and most are able to claim deep historic ties to “too big to fail” financial institutions.
There are also noteworthy differences between the two groups:
- London-based firms long ago got religion about expanding outside their home City, often following clients who led the way beyond the confines of the Square Mile—notably to Hong Kong and other economically significant precincts of the Empire.
- New York firms, by contrast, have until very recently housed the overwhelming majority of their lawyers in Manhattan, out of a combination of calculation, self-satisfied comfort, and inertia, seeing little reason to look elsewhere because the large and deep domestic US capital markets ran exclusively through New York, because a meaningful presence in any other city (London excepted, which we’ll come to) would dilute financial performance, and frankly (I believe) because the United States’ geographically and historically unique position of privileged provincialism, isolated from everyone else by two great oceans, undercut any urgent commercial or cultural need to look further afield.
- To call attention to the self-evident, most London firms have much older roots, some able to boast that they’re “older than the US,” as one cheeky non-Magic Circle London firm does on its website, in those very words. You might think this is a banal statement of the blindingly obvious, but heritage has consequences and deeply, even subconsciously, informs self-image. So, of course, conversely, does relative youth. Cf. New York.
- Famously, the totemic compensation systems are different, London lockstep vs. New York’s eat-what-you-kill, or, in less judgmental terms, performance-based or meritocratic system. Now this is not the place for a discussion of those philosophically divergent approaches to compensation—and indeed, our colleague Richard Rapp has a probing monograph on this very topic in the works—but what I want to emphasize today is that this divide means less and is narrower with the firms we’re about to discus than with almost any other set of US and UK firms.
Which brings us to the topic at hand: Just how have the Magic Circle and New York’s white shoe elite performed over the past several years?
For decades, a legendary New York area sportscaster named Warner Wolf would segue from introduction to specific commentary by declaring, “Let’s go to the videotape!” This being Adam Smith, Esq., let’s go to the data.
And one last note before we do: The data that follows, inevitably, is derived from the best available public sources, but on the right side of the Atlantic that means firms filing public records under the Companies Act and on the left side it means firms reporting to The American Lawyer on the honor system.
By nature and temperament I tend to take a very charitable view of others’ scruples, at least until given convincing evidence to believe otherwise, but before we plunge ahead it’s worth noting H.L. Mencken’s observation about the temptation of indulging in favorable shading of the truth in the absence of consequences: “Conscience is the inner voice that warns us somebody may be looking.”
Using publicly reported data for the years 2008—2013, I compiled or derived these metrics:
- Total revenue
- Total number of lawyers
- Total number of equity partners
- Equity partners as a percentage of all lawyers
- Revenue per lawyer
- Total profits
- PPP
- and profit margin.
The firms I selected for the Magic Circle were, uncontroversially:
- Allen & Overy
- Clifford Chance
- Freshfields, and
- Linklaters
I excluded Slaughters as a special case, and anyone else as a poseur.
For New York, I selected:
- Cleary Gottlieb
- Davis Polk
- Paul Weiss
- Simpson Thacher
- Sullivan & Cromwell, and
- Weil Gotshal
I excluded Cravath and Wachtell as special cases, Skadden (and for that matter, Kirkland and Ltham) as having sufficiently different historical roots, geographic footprints, and business models, as to make them categorically distinct, and I excluded other worthy New York based firms as falling just outside the fuzzy line of the inner-most circle of the highest and most impeccable boardroom pedigree.
Inarguably, determining the “in’s” and the “out’s” of the New York elite, when one is called upon to draw bright, unforgiving lines, can lead to extended debate. The world of top London firms can be envisioned as composed of circles embracing firms with strong commonalities with relatively little overlap. New York is a more chaotic Venn diagram. But I think the list I’ve come up with will do.
The ground rules are that I display each dataset as an aggregate for New York and for London over the years 2008—2013. Totals (revenue, profits) are arithmetic sums and “per XX” series (RPL, PPP) are averages of the total pertinent-city numerator over the total pertinent-city denominator. All currency figures are in US $$.
Let’s start, where else, with total revenue (click any of these charts to open in a new window):
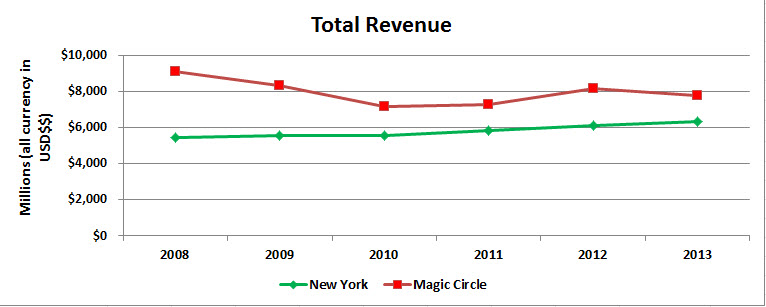
This chart tells two stories:
- The Magic Circle’s revenue has not again been as high as it was in 2008, and the New York firms’ revenue has not again been as low as it was in that year.
- The London/NY ratio in 2008 was about 1.67:1 and by 2013 was 1.26:1
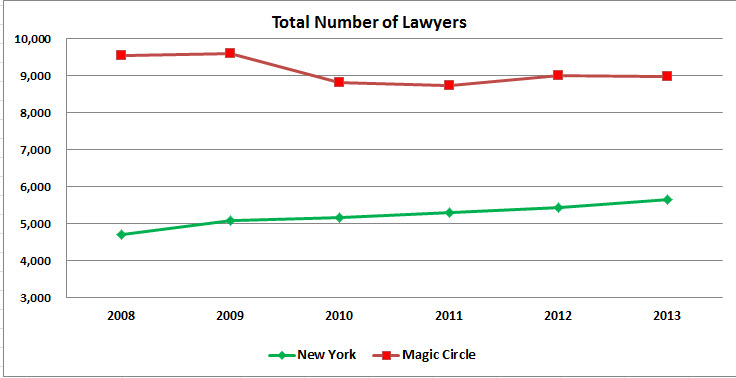
Here’s a very similar story:
- The Magic Circle’s all-time high headcount was 2008/2009 at around 9,600 lawyers and New York’s all-time low headcount was 2008.
- London went from about twice the size of New York to about 1-1/2 times as large.
Great discipline exerted all around. Both these lines are almost horizontal, with strongly constrained growth on the entire half decade. However else they may differ, these firms have tightened the screws at the top.
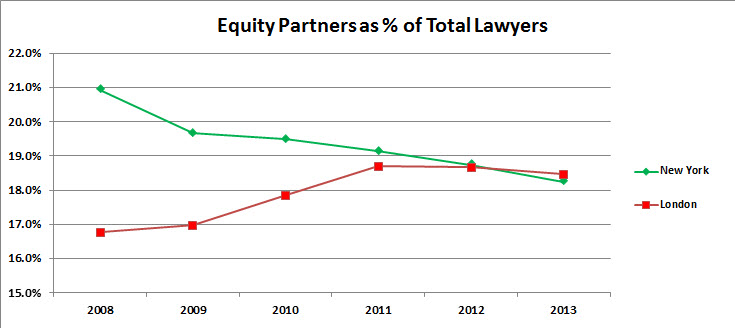
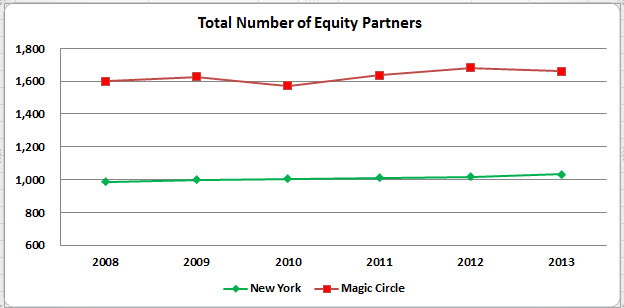
The inevitable sequel to the previous chart, answering the question, “How does total lawyer headcount compare to equity partner headcount?” Not to be Euclidean about it, but just under 20% appears to be the Golden Mean upon which the transatlatnic elite are converging.
Should other firms take heed? Well, at least they should take note.
Now we cross over from the land of tonnage and throw-weight into the realm of judgment and implications.
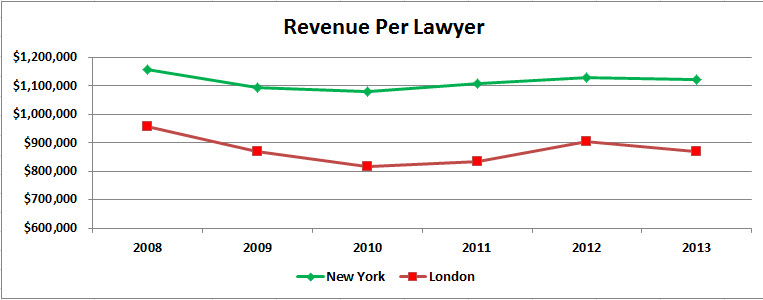
This is the first chart we’ve seen where New York’s green line lies above London’s red line. And I would posit the difference is material: London essentially not above $900,000 and New York essentially not below $1.1-million, or nearly a 25% difference on average.
The next chart is one for which, before creating it, I had low expectations. I expected it to be uninformative. But look:
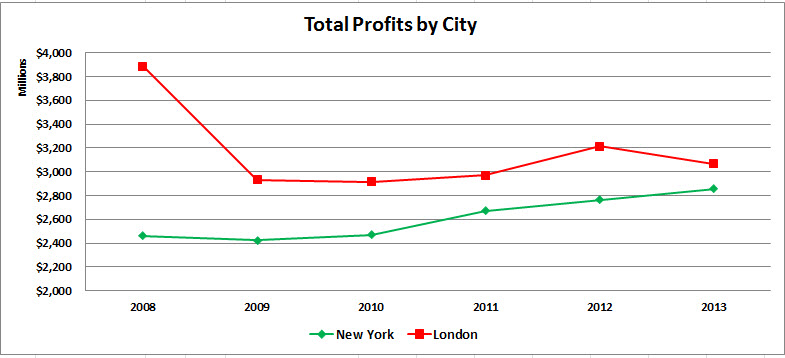
This may be the most dramatic change we see in any of these charts: London’s total profit went from over 150% of New York’s in 2008 to about 110% for the five-year period 2009—2013. And if you look back at the second chart (total number of lawyers by city), you see no comparable change in headcount that would otherwise account for this, all else being equal. London went from about 195% of New York’s headcount in 2008 to about 160—165%.
Now, one you’ve doubtless been waiting for:
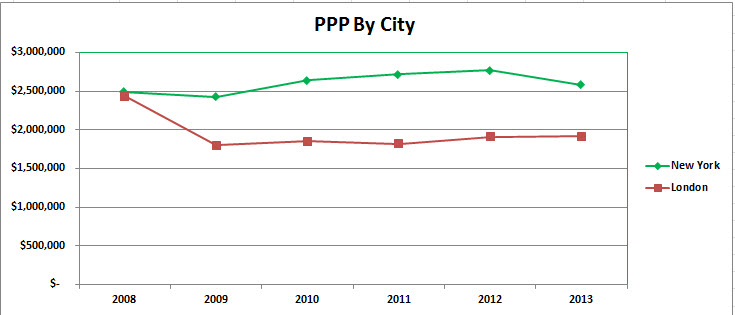
A dead tie in 2008 to a fairly steady run in 2009—2013 of New York above London by about $2.6—$2.7-million to $1.8-million, or about 50% higher. Over time, this is the kind of gap people with options begin to notice.
Next, we have:
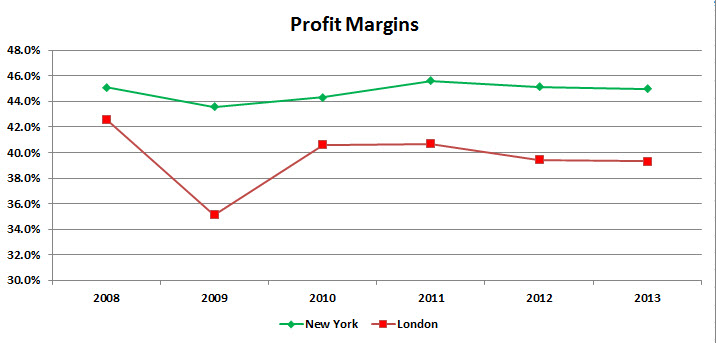
Respected economists, business school professors, and just plain hard-headed CEO’s might tell you that to them this is the most informative chart of all: That New York has remained steadily in a range of 44—46% margins while London has been more volatile but has leveled off at about 40% (12% lower) means that New York firms have more resources year upon year to invest in the organization, pay for talent, and so on. As with PPP, over time this kind of gap begins to tell.
But the next thing all those imaginary observers would focus on is why such a difference exists and whether it refects intrinsic and enduring competitively differentiating strengths or whether it’s merely a creature of a particular time and temporary circumstance or even (worse) reflects short-term profit extraction and maximization at the cost of mortgaging investments in future opportunities.
I think the primary answer may be quite a bit simpler: By and large, the New York firms derive the vast majority of their revenue from New York-centric work, whereas the Magic Circle have far more widespread geographic footprints with proportionately much more of their revenue generated outside the high-margin precincts of Manhattan and the Square Mile.
To see this more vividly, let’s disagregate these groupings of “New York” and “London” and break out firm by firm performance (here’s one chart in particular you might want to click on to see full size):
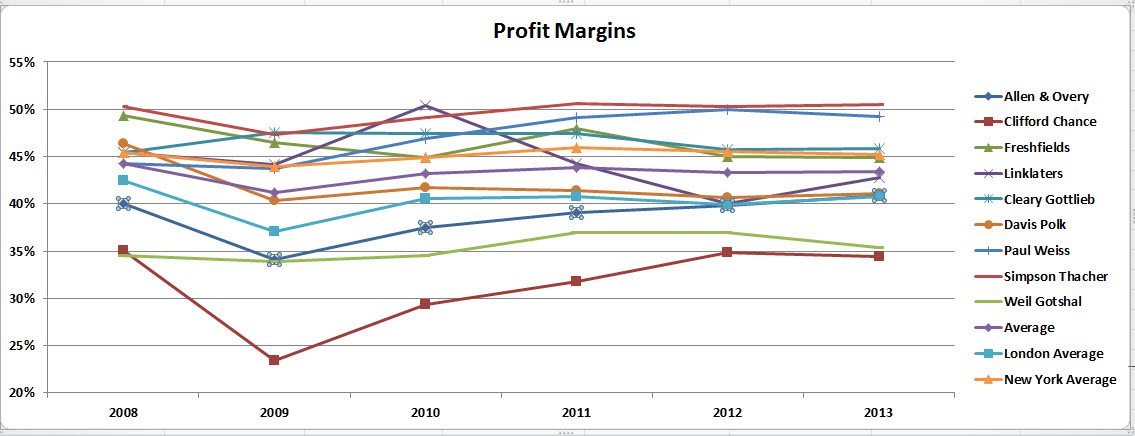
Indeed, Freshfields and Linklaters have embarked on a more selective, more tightly focussed, and frankly more rigorous performance-driven reconfiguration over the past several years, while Allen & Overy and Clifford Chance have continued to expand their office networks to follow clients globally. Debating which structure is “right” or “superior” can be a source of endless entertainment, but for present purposes it comes as no surprise that the consequences of these choices are on display in this very chart.
I’ve provided a fair amount of data for you here, and you may be wondering what particular aspects of it I think really matter.
Well, it all matters, after a fashion, which is why I’ve put this together, but there are two metrics in particular that I think have longer-term consequences for competitive positioning. They are Revenue per Lawyer, or RPL, and Profit Margin.
RPL matters as a very rough and ready reflection of how highly clients value what you do: What will they pay to rent one of your lawyers for a year? (Not partners, not associates, simply the “average” lawyer at your firm.)
Profit Margin matters because, well, the more you have the more you can do. As food and ammunition are to an army, profits are to law firms. Profit is a weapon you can wield as you choose.
So let’s look at two final charts putting these figures on display.
First we have the profit margins vs. the RPL of New York and London firms over the six years we’ve been studying:
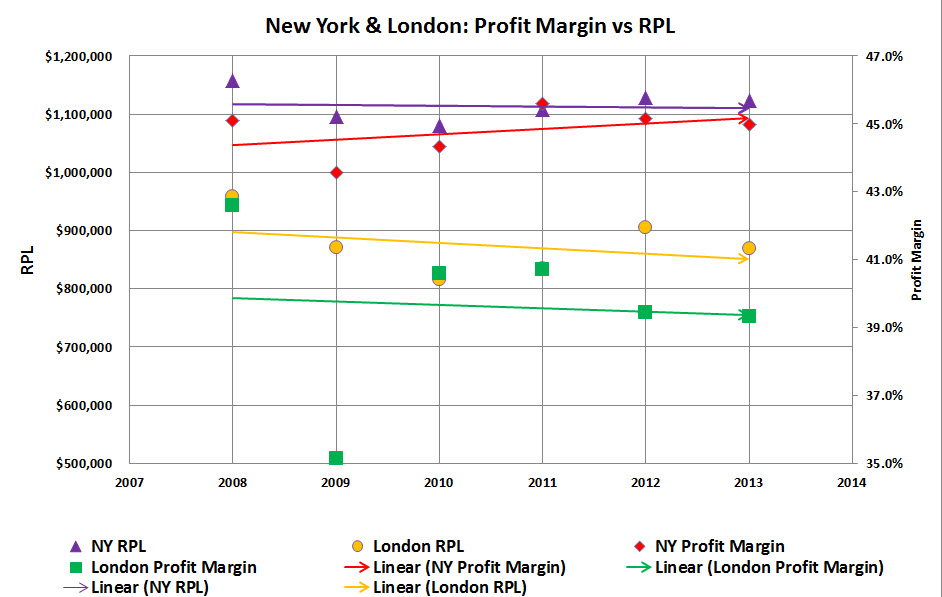
The trend lines [“Linear (London Profit Margin),” etc.] are best-fit linear trend lines for each of the four data series. The markers are the absolute values for each city for each year, with RPL on the left vertical axis and profit margin on the right vertical.
What do you see just eyeballing it?
I see two rather consistent features: New York’s RPL and profit margins are higher than London’s, and New York’s are flat or trending slightly up while London’s are sliding.
Now, let me hasten to add, for those of you desiring an emergency refresher in Statistics 101, that scales matter and you would be well advised to look carefully at the vertical axes before drawing your own conclusions about whether these real differences are material.
Finally, let’s redraw the same data into a scatterplot of NY vs. London and RPL vs. profit margins, by year. Voila:
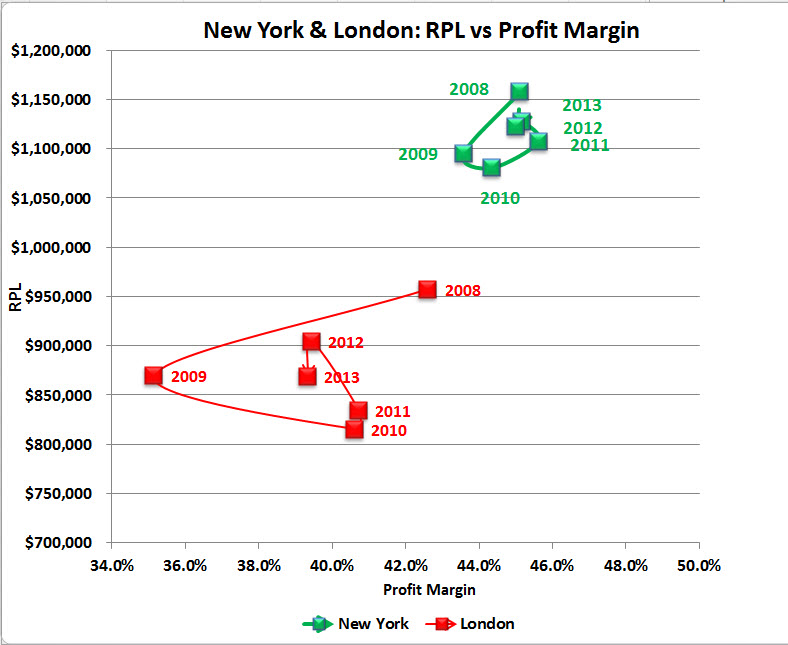
The differences are, I submit, more pronouncedly evident in this rendering of the data.
- New York is above and to the right of London for the entire period
- London displays more volatility (although it represents four firms to New York’s six), and
- While the gross trends over the six year period were the same in both cities—2008 very good, 2009 much much more, and 2010—2013 a slow incremental recovery—New York is closer to making up the lost ground than London.
What does this all mean? That merely depends on how you see global capitalism and finance evolving over the next couple of decades. And if you can see that clearly and unerringly, are you sure you shouldn’t be working for the NSA or MI6?
To oversimplify:
(1) If you think the rise of the East and the South will continue or accelerate, and accordingly that London and New York will matter relatively less in 2020 or 2030 than they do today, then Allen & Overy and Clifford Chance are “right” and any firms with 95% of their lawyers in one zipcode or time-zone may need to perform a midcourse correction lest history leave them behind.
(2) Alternatively, if you think the United States will be the world’s only superpower for as far as the eye can see, with New York its indisputable financial and intellectual capital, and UK-rooted Anglo-Saxon common law the lingua franca of international commerce, then Allen & Overy and Clifford Chance are “wrong” and may need to pivot.
And I suppose if you think the Visigoths of disruption are marching relentlessly on the Citadel of BigLaw, in serried columns from the north, then this entire essay has been a quaint exercise in nostalgia.
The morals here are at least two: First, it is not mere anecdote or urban legend that New York’s elite and London’s Magic Circle are embarked on different strategies; the data shows it to be true. And second, at the highest level of generalization, those different strategies reflect different world-views. The differences stem not from perversity or blindness or provincialism, but from profound differences of opinion in where global commerce is going and how the world’s globally elite law firms should configure themselves to remain on top.
And a third moral: Visigoths or no Visigoths, the only serious mortal threat any of these firms could face will arise within themselves—through complacency, self-satisfaction, short-termism, or a surrender to greed.
What do you think this lineup will look like in 2020?


Very interesting – thank you!
Do you think that the figures are (heavily) impacted by currency fluctuations between 2008 and 2013?
You’re welcome!
The short answer, to my mind, about currency fluctuations is:
My bottom line is: Can’t do anything about them, so let’s ignore them.
How do the numbers differentiate (or do they) between compensation paid to equity partners as profit v. salary treated as an expense? Is everything paid to an equity partner treated as profit?
On a less serious note, any post that references Warner Wolf is ++ in my book. Now if you can somehow work in a reference to Jerry Girard we’d really be talking.
Unfortunately you’ve completely ignored the fact that the pound –the billing currency of the lion’s share of magic circle ops — was at multidecade highs of over $2:£1 in 2008, then fell back by about 25%, with high volatility (like all financial markets!). This by itself accounts for most of the trend in several of the charts you put forth which measure performance in dollars. Of course New York looks less volatile when you measure things in US currency! Of course the Magic Circle declines during years when GBP declines! It’s a shame you didn’t think to address this variable since it is a far more significant determinant than any of the theories you put forth in your article.
I actually used each year’s average GBP/USD exchange rate for that year, as opposed to one average over the entire period. That’s the methodology.
As for the substance of your observations, let us stipulate that the currency movements you posit are correct. What, then, is one to do in terms of analysis? I don’t think the managing partners of any of the firms identified in the piece would suggest they be ignored, or can be ignored in real life when it comes to partner compensation time. At the risk of being simplistic, yes indeed currencies fluctuate. It strikes me as a hard fact on the ground that one simply has to build into any crossborder analysis of this sort. I don’t see any alternative route.
You finish this with the question “What do you think this lineup will look like in 2020?” Might now be a suitable time to revisit?
In ordinary days, you would not be wrong, but given what’s going on in the world this year I think it only prudent to table this until we emerge on the other side, either via universal vaccine or brute-force herd immunity, which some elected leaders seem to be pursuing in deed if not in word.