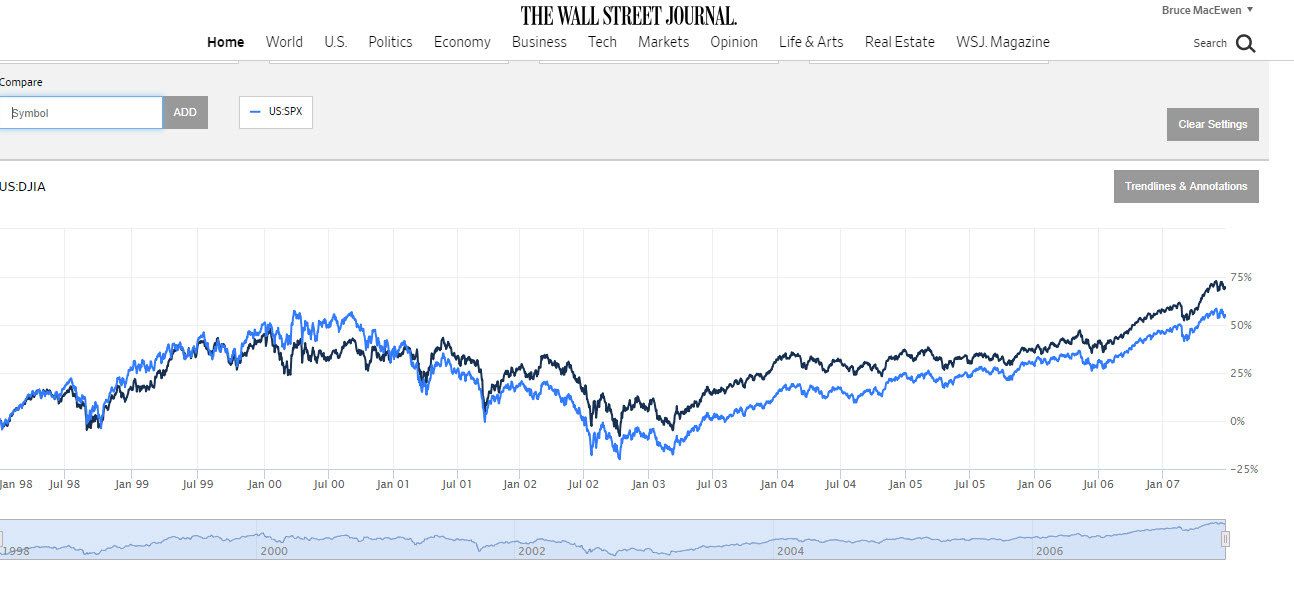
Dow and S&P 1998 to 2007
This shows that the Dow rose about 69% and the S&P about 55% over the earlier period.
Here’s the later chart:
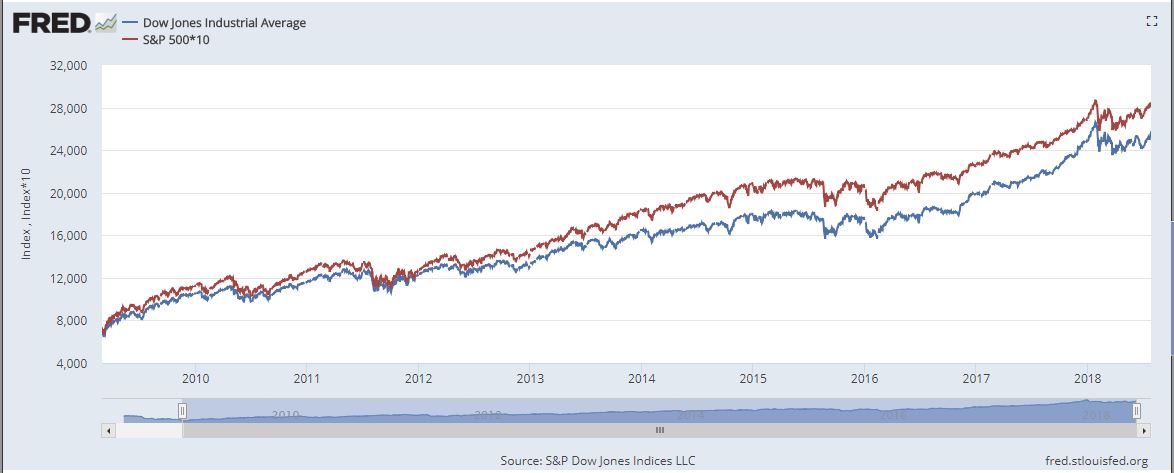
Dow and S&P 2008-2018
This shows the Dow up about 124% and the S&P 122%. Impressive, and if you subscribe to the notion that corporate C-suite “animal spirits” motivate M&A, strong hiring, and the expansion of everything from geographic footprints to product/service lines to R&D capability, then you have to consider this a Force 5 or 6 wind at your backs (using the Beaufort Scale).
Unemployment is another one of those top three or top five economic indicators of health, so here we have it. Our first period:
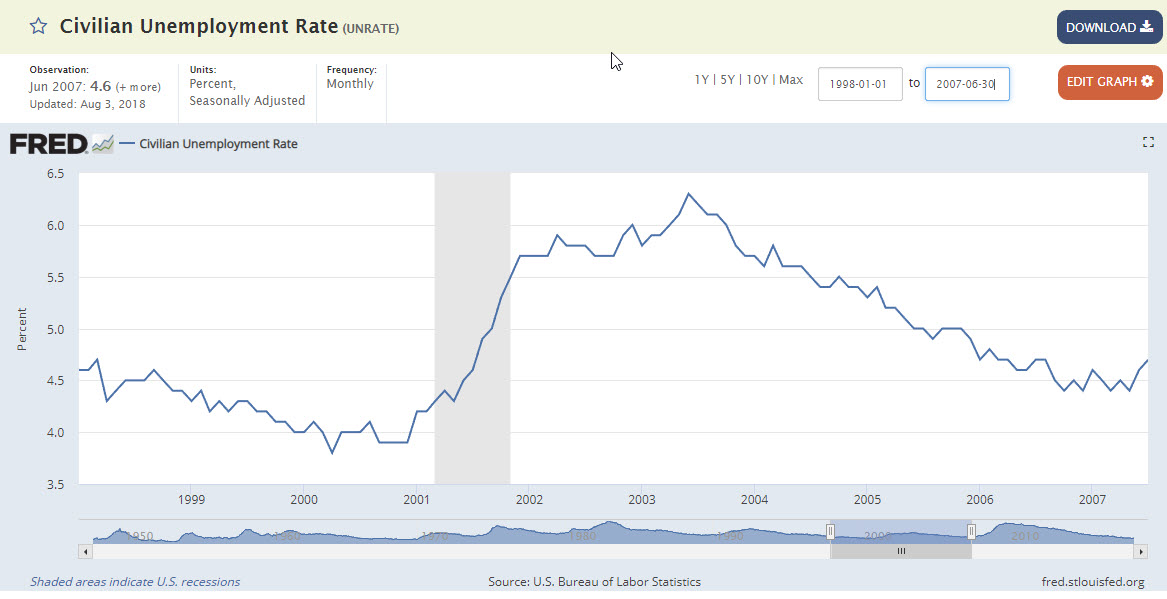
Fred Civilian Unemployment Rate 1998 to 2007
Spiking up in honor of the dot-com recession and staying above 5.5% for another three years or so. Quite decent by postwar standards.
But the second period of our choice? Unemployment rates don’t drop this long or this far without very strong economic demand.

Fred Civilian Unemployment Rate 2008-2018
Two final data series.
First, industrial production since it’s viewed, still, as the hardest core component of the economy. It also tends to support high-value jobs and to have a “multiplier effect” outside the pure manufacturing industry that’s greater than that for a similar X% of GDP generated by, say, restaurants and hotels.
Our first period:
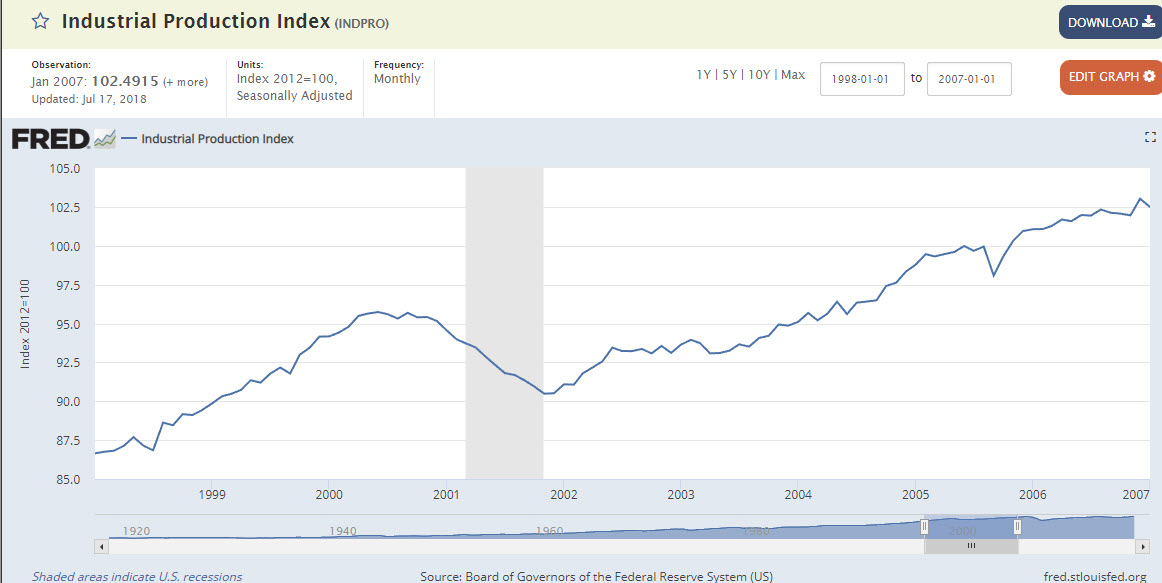
Fred Industrial Production 1998-2008
Net growth from 87 on the index scale to 102. A respectable decade.
And our second period:
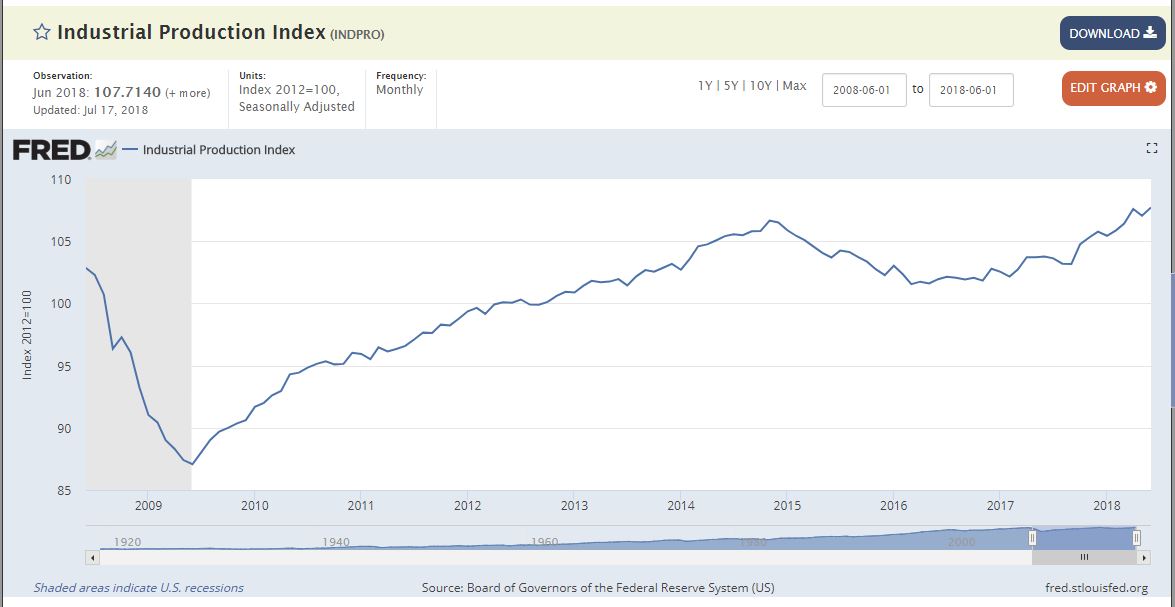
Fred Industrial Production 2008-2018
Coincidentally, from pretty much the same starting point, 87 (at the trough) to 108: Stronger still than the comparable period.
Finally, a data series that should be near and dear to the hearts of anyone in a global or cross-border law firm: US exports of financial services. (Who knew Fred would have such a data series? But ask and ye may find.)
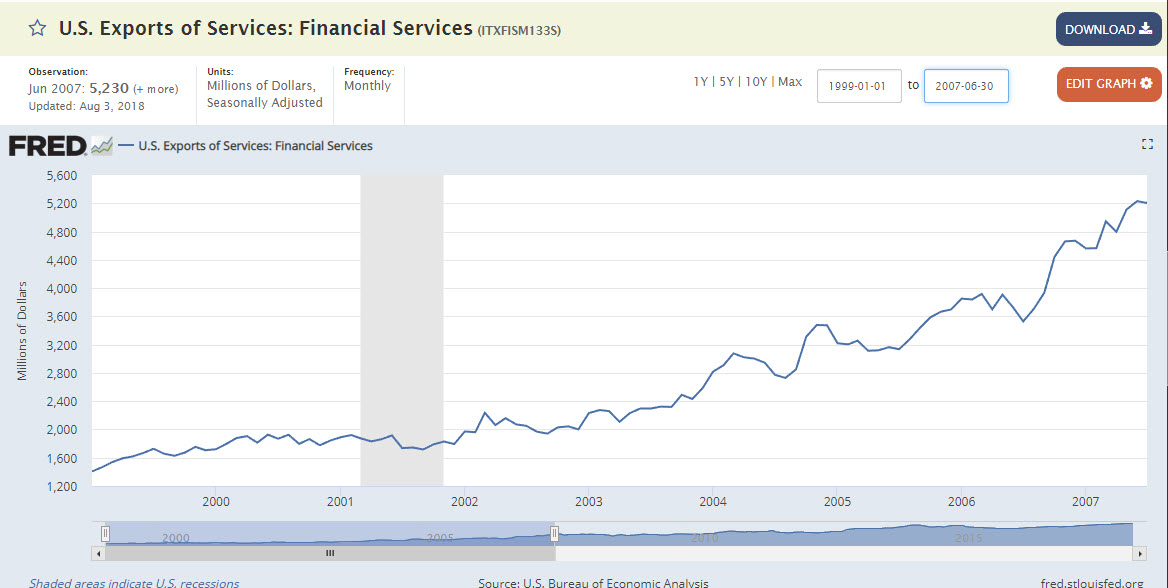
Fred Financial Services Exports 1998-2007
From about $1.4-billion in 1998 to four times that, $5.2-billion in late 2007.
And finally:
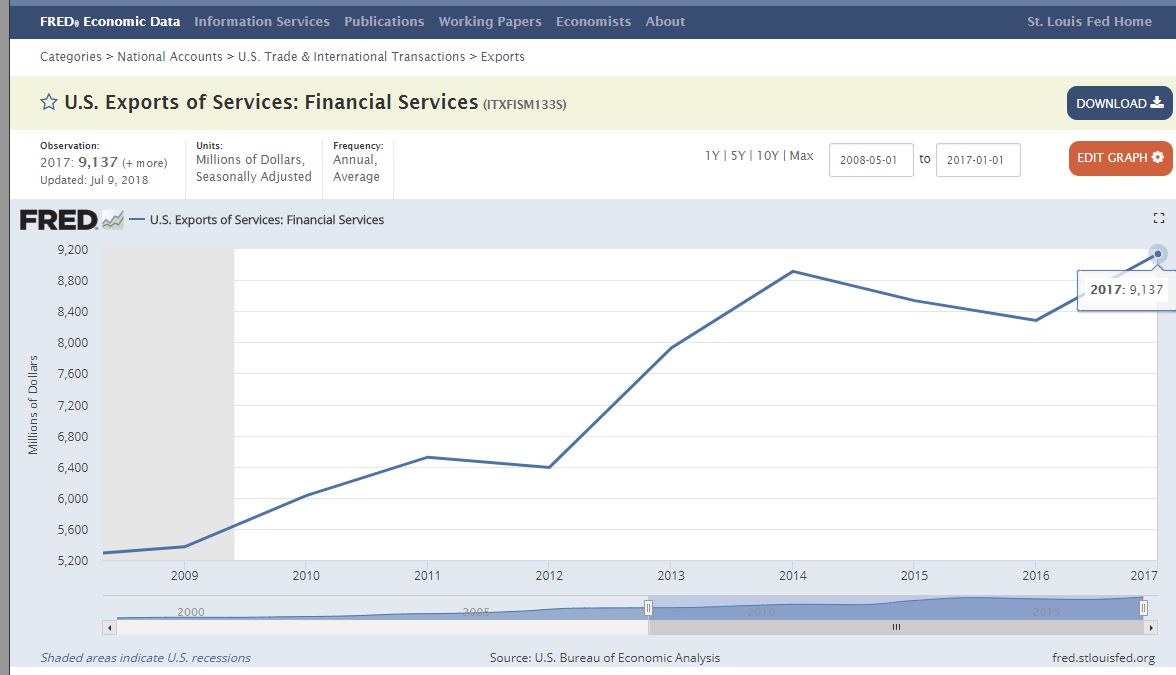
Fred Financial Services Exports 2008-2018
From $5.3-billion at the outset of the period to $9.1-billion at the end; less than a doubling, but consider the sheer magnitude of the data series throughout the period. It was never lower than in our prior period, and growing at healthy double-digit rates most years. That should be enough to push along cross-border BigLaw work, no?
I’ll close our deep dive into data her by noting something you have not seen: Consumer price inflation (CPI). That’s because it essentially didn’t matter over the past 20 years. It was solidly under control so not a “player” in national income statistics. How CPI figures into GDP and the other series you’ve just walked through with me is, as I see it, more as a building block (or crumbling foundation) underlying consumer and business confidence than as an indicator of economic activity in its own right.
Seguing back to Law Land, here’s that gripping chart I promised you out of ALM Intelligence showing the performance percentage change in revenue of each of the AmLaw 50 firms (anonymized–ha ha!) over the past 20 years: Blue/gray boxes are positive numbers, white is 0, and pink are negative.


Bruce, this neatly addresses one of the two explanations of the “slow growth” issue discussed by Nicolas Bruch in his Feb 2018 article (n1), i.e. “broader economy” vs. “increased competition”.
Without getting into the nuances of those two theories, I think a third type of possible explanation is also worth throwing into the mix, to do with scalability.
Starting with the observation that, within a given firm, lawyer headcount is, of course, a key driver of revenue on the standard business model –
* What if such headcount is only scalable up to a certain point (high hundreds / low thousands?) before the resultant costs and constraints impede the ability to grow further while maintaining / enhancing profitability and stability?
* What if, also, for many large, highly profitable firms, that point had been more-or-less reached by 2007?
I don’t have access to the AmLaw dataset, but Legal Business did a striking analysis in Dec 2017 of large UK firm revenue growth in the last ten years compared with the ten years before. Quoting from the editor’s summary (n2):
“Stripping out shops that executed large-scale mergers, have been taken over or who entered or exited the top 100 during the ten years, left us with 53 firms for a roughly like-for-like comparison of underlying growth. The top firm is Mishcon de Reya, holding the spot after nearly quadrupling its income between 2007 and 2017. The rest of the top ten is comprised of largely mid-weight players, including Watson Farley & Williams (WFW), Fieldfisher, Osborne Clarke, Stephenson Harwood and Holman Fenwick Willan, with all of these firms comfortably doubling revenues. With the exception of Bird & Bird, none of this group generated even £100m at the height of the 2000s’ boom. Equally striking is that many of the top-tier legal brands rank in the lower reaches of the table. Allen & Overy (A&O) sits in a lowly 24th slot. Freshfields Bruckhaus Deringer, Clifford Chance and Linklaters, meanwhile, cluster in the bottom third of the table, coming after a 2016/17 when their revenues all got a sizeable forex-induced bump. Other major firms in the bottom quartile for revenue growth include Simmons & Simmons, Eversheds Sutherland and Addleshaw Goddard. So much for the notion of the big law firms pulling away or a flight to quality.”
Of course it would be foolish to suggest a single cause for anything this complex, but my impression is that the impact of organisational size has been non-trivial in the last ten years, and I suspect there are various factors which will make it more significant over the next ten.
(1) https://www.law.com/2018/02/14/why-are-law-firm-growing-so-slowly-the-answer-may-/
(2) https://www.legalbusiness.co.uk/comment/super-growth-or-decline-which-firm-are-you/
Graeme:
Fascinating on all counts. A couple of supplementary thoughts:
I’ve spent a fair amount of time wondering where those pre-2008 good ol’ days went and whether they may return. My perspective is primarily the litigation side of the business. Here are a few thoughts:
1) Pricing pressure – clients started questioning bills. A case that pre 2008 would have fetched $5 million post 2008 was worth $1.5-2M. They hired cadres of in house lawyers to review and cut bills, negotiate fee caps and flat fees, and force firms to do in depth, free “pitches” for cases. They convinced firms to take cases as a “loss leader” but never followed up with more work because there is a never ending supply of new firms. They eliminated block billing, team meetings, and document review by associates. All of that reduced firm revenue and is unlikely to go back to the way it was.
2) Specialization – someone, be it firms or clients, decided highly specialized lawyers were a better sell. Now rather than having litigators, you have commercial and patent and soft IP and antitrust and class action and bankruptcy. If one area has a down year you have extra capacity because it is too hard to move a specialized lawyer to another area.
3) Streamlined cases – the pricing pressures combined with doc review by people who don’t know the case means there are fewer depositions, less motion practice, and fewer trials. This also means there are far fewer opportunities for young lawyers. As a second year associate at a big NY firm, I took depositions. Years later when I was at a big Chicago firm, associates were making partner having only ever taken one deposition in their 7th year.
Ultimately I don’t see how it can ever go back to what it was. But I also don’t think the old guard in firms has truly adapted. Rather the focus is on lateral hiring and increased hours from fewer associates. It’s not sustainable.
Dear Allison:
First of all, thanks for your truly reflective response, providing perspective from someone who was there “before” and “after.”
While I heartily agree with all three of your primary observations, permit me to add a few supplementary thoughts starting from your closing observation that “the old guard in firms has[n’t] truly adapted” and that the focus on lateral hiring (a zero-sum game) and flogging the associates’ hours harder (all kinds of malign consequences from low morale to time-padding temptations to hoarding, and on and on) are neither sustainable nor smart ways to run a business.
I see a common thread in all three obstacles you point out: If we continue to refuse to “truly adapt,” they’re essentially insoluble. They are evolved features of the system we have built and that clients have learned now (to our rue) to adapt more to their purposes. We can’t claim (see much of the above) that clients are doing anything we didn’t open the door to their doing, and invited them to walk through on top of that. (If we didn’t raise rates every year, maybe discounts would erode and realization would improve.)
The answer as I see it has to start with a combination of more flat-fee and project/staged billing. While we’re at it, we have to take the lateral recruitment needle out of our arms. Hire very very selectively to fill gaps in capability, yes; try to rent revenue with stupendous friction and transactional costs upfront, no.
Finally, where will all the veteran, experienced sages of the future come from if there’s nowhere for them to be trained because there’s nothing for them to do (NewLaw + AI have stepped in) as juniors? I have no snappy answer to this. But I’m working on it.
Thanks again.
A note on the much-maligned concept of “command and control” as a management style. The archetype of command-and-control management is the military, where the full formulation is usually command-control- communications- and-Intelligence, “C^3” (c-cubed). The additional terms – especially translated at least partly metaphorically, to business – matter. A command-control management without communications would be the sort of straightjacket that many fear, and unless the system is underlain by appropriate “intelligence” (which today, of course, may be AI, at least in part) we know that the probabilities of success diminish, often rapidly, toward zero. It would be interesting to see how people familiar with operating C^3 in high-stakes businesses (even as “counselors”, for example at McKinsey) would see its appropriate application to Law.