What is the “yield curve” and why should you care? Well, first off, it’s not remotely the kind of topic we regularly write about on Adam Smith, Esq., because it seems far removed from “the economics of law firms,” but then again, seemingly everywhere we go the last three to six months we’ve been hearing increasing chatter along the lines of “What is your firm going to do if there’s an economic downturn?”
So we’ll make an exception, of sorts.
For the first time since The Big One of 2008, people are talking about a recession. Now, there’s nothing to be “done” at the moment, even if you knew to a fare-thee-well that a downturn was coming (and if that’s the case I’d like to borrow your time machine for a minute–just to check a few asset prices in, say, 2028)–but you can at least make some sane plans.
For example: “What would a 5% expense cut do to your department?” “10%?” Or (harsher), “If you had to identify the people at the very bottom of performance evaluations in your area, do you have that list prepared?” You get the idea.
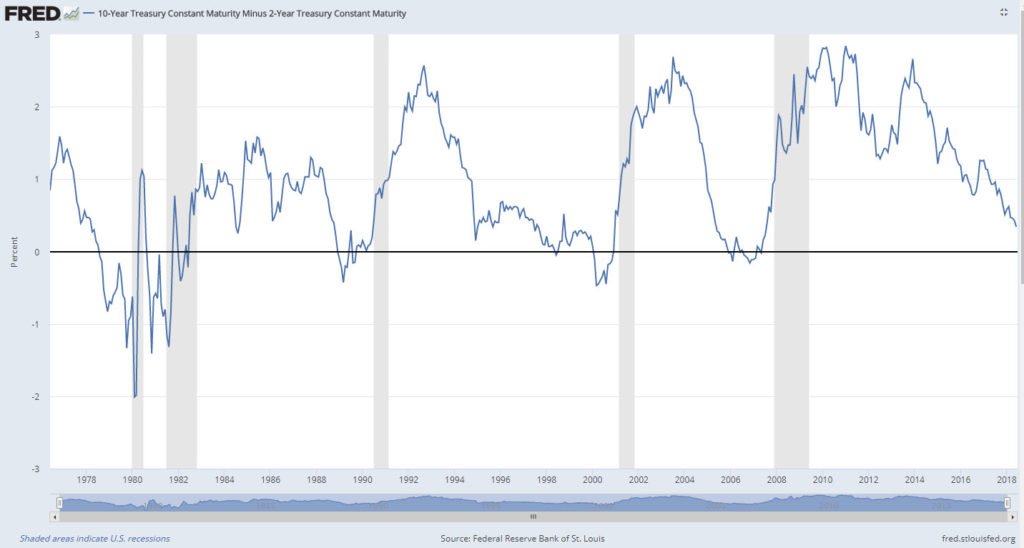
Bringing us to the Yield Curve. Technically, it charts the difference between the yield on short-term and long-term Treasuries: Typically the 2-year vs. the 10-year. In normal times it should be a positive number since investors demand a premium in yield for longer-term lending: More bad stuff could happen, inflation could rise, some crackpot somewhere in the world could do what crackpots do, etc. But sometimes it “flattens,” meaning the difference between the long-term and the short-term rate decreases. It’s been doing that for quite a few years now (see below).
The extreme version of flattening is “inverting,” where the long-term rate drops below the short-term rate. You don’t want to see this happen since, as NY Fed President John Williams said recently, inversions are “a powerful signal of recession.” And while we’re talking the Fed, research from the SF Fed found that every one of the nine recessions of the past 60 years has been preceded by an inverted yield curve. (There was one false positive in the mid-’60s when an economic slowdown but not a formally defined recession followed a period of inversion.)
Of course, “past performance…,” but you might take a look at this yield curve graph going back 40 years, thanks to the redoubtable data jockeys at the St. Louis Fed (shaded areas indicate US recession). Don’t say we didn’t warn you.


