Coming to the fore more prominently these days across a large portion of firms we work with and the industry overall is the issue of succession planning. It comes up in one or both of two contexts, (a) transitioning key client relationships from incumbent partners to the next generation, and/or (b) handing off leadership of the firm itself.
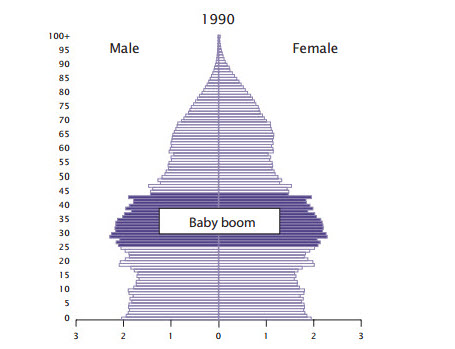
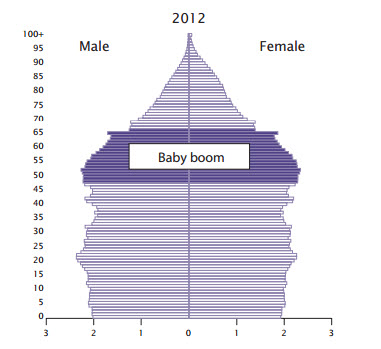
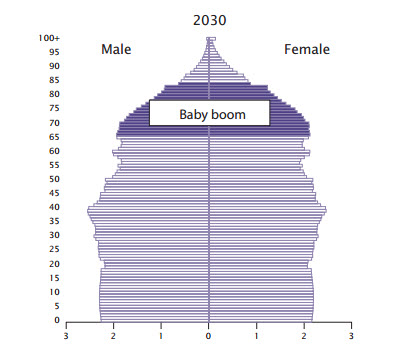
When this comes up, people tend to point to the baby boom generation nearing retirement, and everyone nods knowingly, but have you looked at the actual numbers? Since “going to the numbers” is our instinctive preference, we did, and thanks to the US Census (“The Baby Boom Cohort in the United States:2012 to 2060,”) you can see for yourself.
If you haven’t seen this type of visual display before, we’re quite fond it for the density and clarity of information it displays. It shows male (left of the midpoint) and female (right of the midpoint) population by age in years (vertical axis) and percentage of the total US population (positive numbers increasing to the left and to the right from the midpoint). A picture, or three, is indeed worth a thousand words.
1990
2012
2030
You can run, but you can’t hide.
Now, back to the topic at hand.


