And for all the sanctimonious and patronizing political rhetoric spilled over TARP and all the other recovery measures, with the right denouncing governmental profligacy and the left excoriating “giant squids” of Wall Street, we finally agreed to enact a few measures that at least tried to address things, however blinkered our knowledge about what actually works in these unprecedented situations.
For Law Land, then? If your firm has a rough patch, resist the temptation to indulge in blame, naming the guilty or accusing the complicit. I know this is contrary to every lawyerly bone in your body, where a presumptive accusatory outlook on life and skeptical I-told-you-so’s are second nature, but just for once try to get past it.
Focus forward. Figure out what might work and try it. If it doesn’t, try something else. Get right back up on the horse that threw you, in other words.
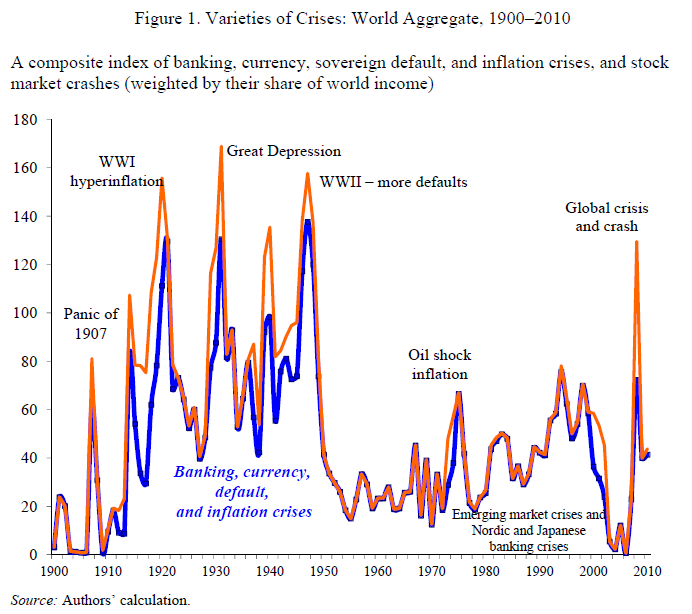
And finally, a chart from yet another Reinhart & Rogoff paper, this one from December 2013 entitled Financial and Sovereign Debt Crises: Some Lessons Learned and Those Forgotten, an IMF Working paper. If this doesn’t persuade you our recent episode was a doozy, nothing will. First the chart, then an interpretive note:
Visually, you can tell our latest economic crisis has been one of the most serious of the past century. If that’s all you need to know, stop here.
If you’re interested in how the chart was derived, this represents Reinhart & Rogoff’s own invention of a composite index across each of the world’s economies for which data is available of (a) banking, (b) currency, (c) sovereign default, (d) inflation crises, and (e) stock market crashes, each rated on a scale of 1-5, and then weighted according to each counry’s share of world income. Got that? (Read it again; it’s actually a tour de force in data reimagination.)
So if your partners are wondering why the environment seems so challenging, you don’t need to say a word.
Show them a picture.


“For example, US homeowners who walk away from an “underwater” house lose the house, but they’re no longer liable for the mortgage debt.”
Is the writer assuming a bankruptcy filing? Otherwise, isn’t that statement accurate only in states ( a minority I think) with anti-deficiency laws?
Bruce,
Why does Reinhart & Rogoff’s graph from a Dec 2013 paper stop at 2010? What do the last 3 years show?
You’d have to ask them! (I would assume that’s as far as the data from various nations could take them.)